
ARS Develops Freeze Date Tool for Localities
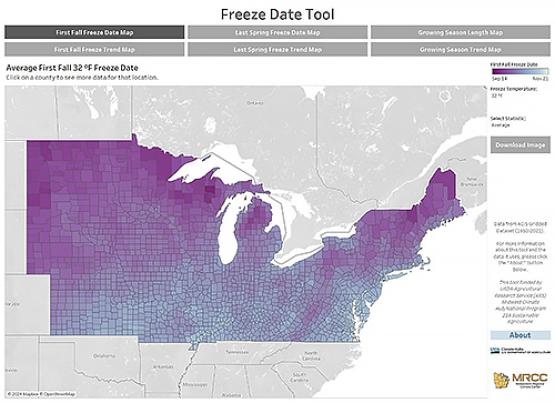
(Image courtesy of Midwestern Regional Climate Center)
Agricultural Research Service (ARS) climatologists have developed a first-of-its-kind Freeze Date Tool. Operated by the Midwestern Regional Climate Center at Purdue University, the Freeze Date Tool is a publicly accessible zone map that pinpoints temperature changes for growers and planters at the county level. Previously, freeze zone temperature maps were only available state-wide.
“Now we have a website that provides the ability to click on a location where growers can see how spring and fall temperature cutoff dates have been changing since 1950,” said Dennis Todey, climatologist and director of the USDA Midwest Climate Hub in Ames, IA.
“For farmers and planters, the Freeze Date Tool answers the question, ‘What is the range of time from the last spring freeze to the first-fall freeze?’ We did not have the ability to do that before,” said Todey. “It does have an impact on perennials and row crop production in that there now is a longer growing season to work with.”
Currently, the Freeze Date Tool’s temperature data centers on the Midwest, North Central, and Northeast regions of the United States.
“These are the areas of the country where the freeze dates are changing the most,” said Todey.
The Freeze Date Tool and website is managed by the Midwestern Regional Climate Center through an ARS partnership with Purdue University. The tool displays freeze dates by trend, decade, and growing season. In addition, it provides freeze date and growing season tables indicating temperature changes from 1950 to the present for each county.
“We’re also working to augment the Freeze Date Tool with additional pieces of information because certain crops have different vulnerability to freeze dates,” Todey said. “That’s very important depending on what kind of crop you’re growing. As temperatures change, the freeze-frost zone map gives growers the ability to access the direction of those changes.”
The Midwest Climate Hub, located at the National Laboratory for Agriculture and the Environment in Ames, IA, initially developed the temperature data in conjunction with state climatologists.
“We were able to incorporate a lot of feedback from regional partners during the development of the Freeze Date Tool,” said Todey. “We are trying to develop even more tools and data for farmers and growers to try and explain how climate is changing around them.”
His team at the Midwest Climate Hub is continuing research to find out what may be causing some of the differences in the freeze/frost temperature dates across the United States.
“We are trying to understand the regional nature of the temperature changes,” Todey said. “Northern areas of the country, immediately adjacent to the Great Lakes for example, are consistently seeing longer growing seasons, whereas areas further south, are not as consistent.
“Determining more specifically why these areas are different is part of our research related to this project.”
Most recently, the Freeze Date Tool was recognized within the Fifth National Climate Assessment, published Nov. 14, 2023. Utilizing data from the Freeze Date Tool, the Climate Assessment focuses on the Midwest Region of the country, and its trend toward increasing temperature changes. — Tami Terella-Faram, ARS Office of Communications